Adversarial evidence on absent, negative, and overstated AI benefits
Research date: 26 October 2026
Question: What credible evidence shows that AI can yield no detectable business/economic/productivity gain, negative outcomes, or less benefit than adoption or promotional claims imply?
Scope: Evidence on classical/predictive and industrial AI is kept distinct from generative AI (GenAI), LLM copilots, and autonomous computer-use agents. This report records studies, surveys, analyses, and their limits. It does not estimate one universal AI effect.
Research method and reading limits
The search began with the supplied TechCrunch article and followed its link to Apollo’s 24 October 2026 note. Search then covered firm-level realized returns, measured work outcomes, macro productivity, adoption intensity, coding and verification, organization costs, cognitive effects, customer service, agent reliability, historical/industrial AI, and the measurement or promotion of AI claims. I prioritized original papers, official statistical and central-bank sources, original survey/report methodology, and published research pages over articles that merely repeat a study. Secondary reporting is identified when it supplies the only readable account.
The source register records access level for every item: full text/page read, selected full-text sections, abstract/summary only, or inaccessible source material. “Directly read” means that the source page or available paper/report text was inspected; it does not mean every appendix, raw data file, or paywalled full article was available. No paywall was bypassed. The seed article and Apollo note are accessible. Apollo’s five chart images and their credit lines are linked below, but the note does not provide a downloadable chart-data table or an AI treatment/counterfactual series. That limitation is material.
Evidence labels distinguish negative (an observed adverse estimate in the stated setting), no detectable effect (the study did not detect an effect at its resolution; not proof of exactly zero), mixed (outcomes differ by task/group or point in opposite directions), limited/low (diffusion, magnitude, or outcome coverage is small), not yet measured (e.g. forecast rather than observed return), and positive in a bounded setting. Survey estimates are participant or executive reports unless an administrative, financial, or task-output measure is expressly stated. They should not be silently converted into causal productivity, profit, or revenue estimates.
Source-count and deduplication note
The register contains 41 source records. Grouping the Apollo note with its chart series, METR’s 2026 follow-up with its 2025 experiment family, Stack Overflow’s 2024 and 2025 waves as one recurring survey series, and the HBR article with the UC Berkeley ethnography it reports gives 34 distinct empirical evidence families. The TechCrunch seed is reporting, while the FTC enforcement record and Goldman Sachs commentary are contextual records rather than separate productivity studies. Multiple articles repeating the same study are not counted as additional evidence.
1. The seed claim and the Apollo evidence
The seed article reports that Apollo Chief Economist Torsten Slok found flat revenue per worker and profit margins for the “S&P 493” (the S&P 500 excluding the seven large technology firms) and no sign of a productivity-growth increase. It characterizes this as “zero financial payoff” outside tech. The exact source is Slok’s Apollo note, not an experiment or a firm survey. It presents five charts. Apollo attributes chart 1 to Bloomberg, Macrobond, and Apollo and says it is inflation-adjusted to 2019 Q4; chart 2 to Bloomberg, Macrobond, and Apollo; chart 3 to the San Francisco Fed utilization-adjusted total-factor-productivity series (Fernald, 2014), BLS, and Apollo; chart 4 to Ramp’s AI Index and Apollo; and chart 5 to Ramp’s AI Index and Apollo. The direct image links are chart 1, chart 2, chart 3, chart 4, and chart 5.
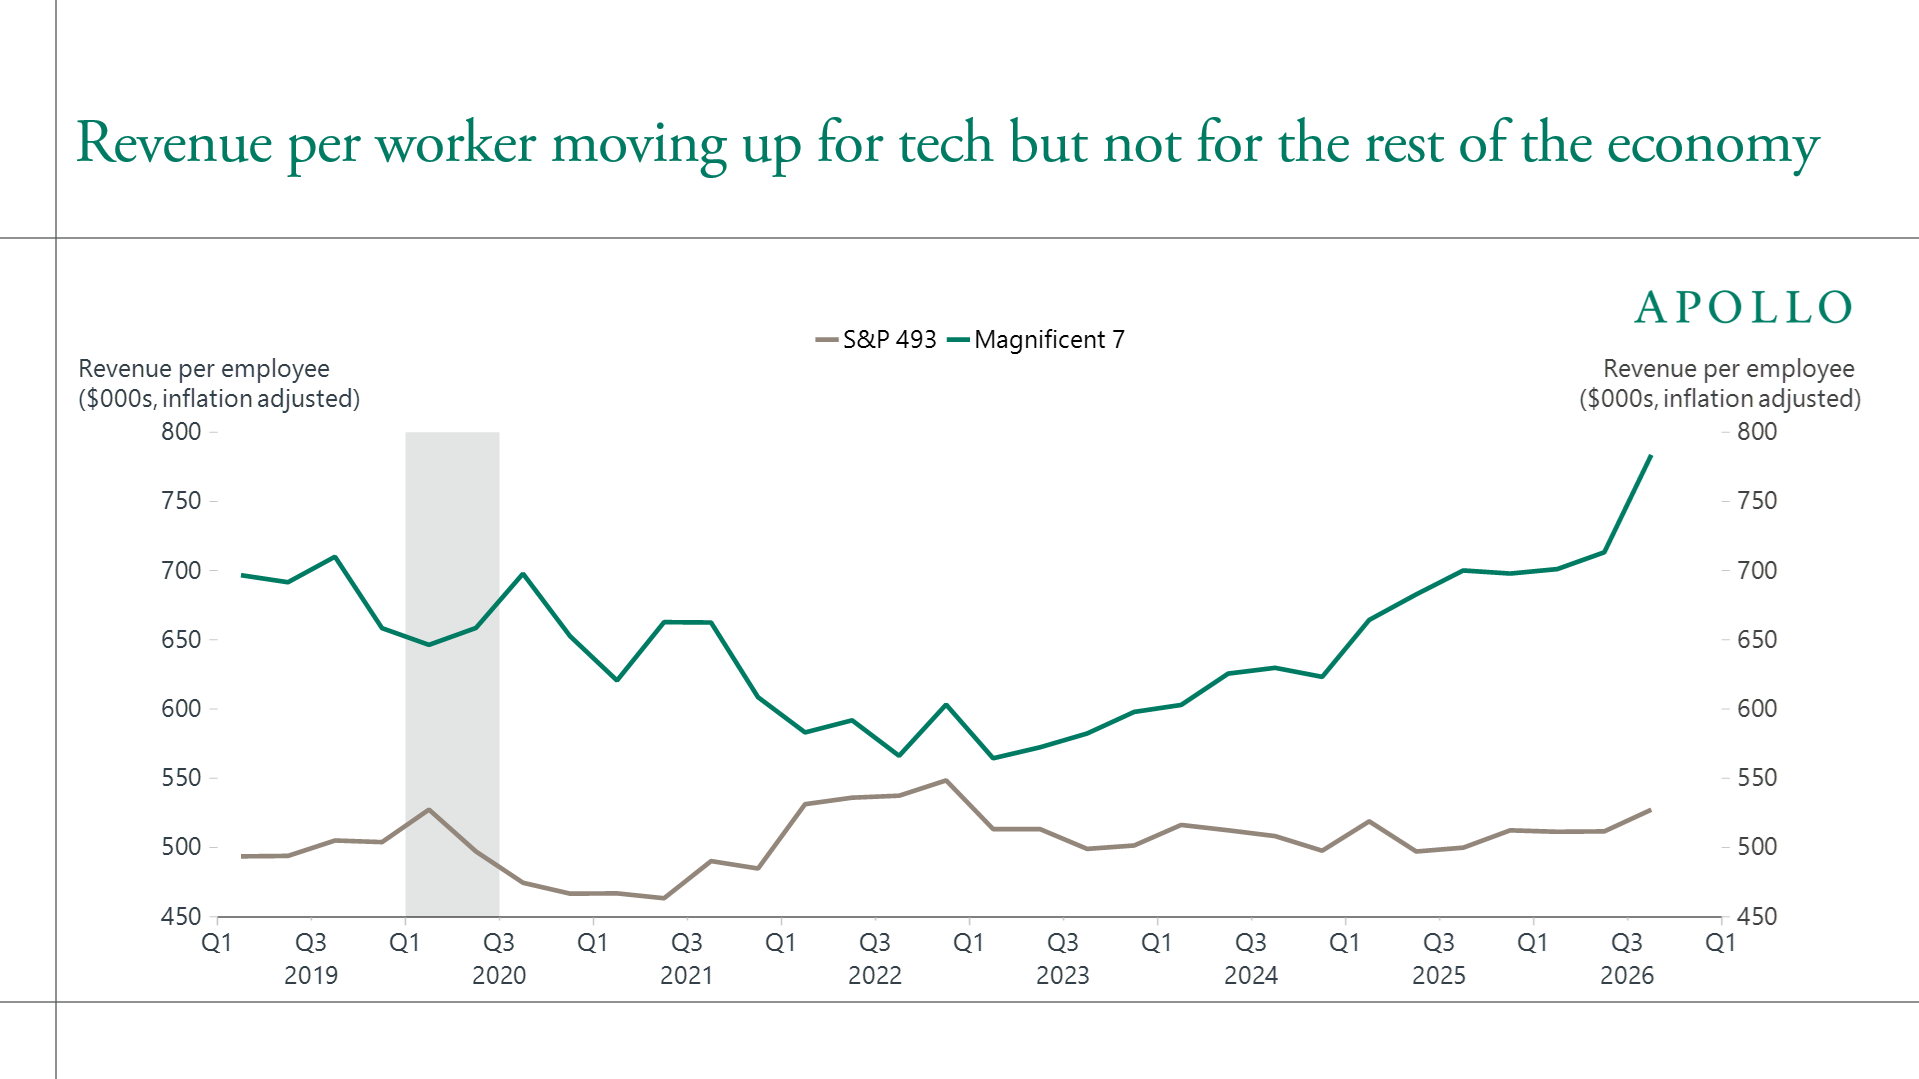
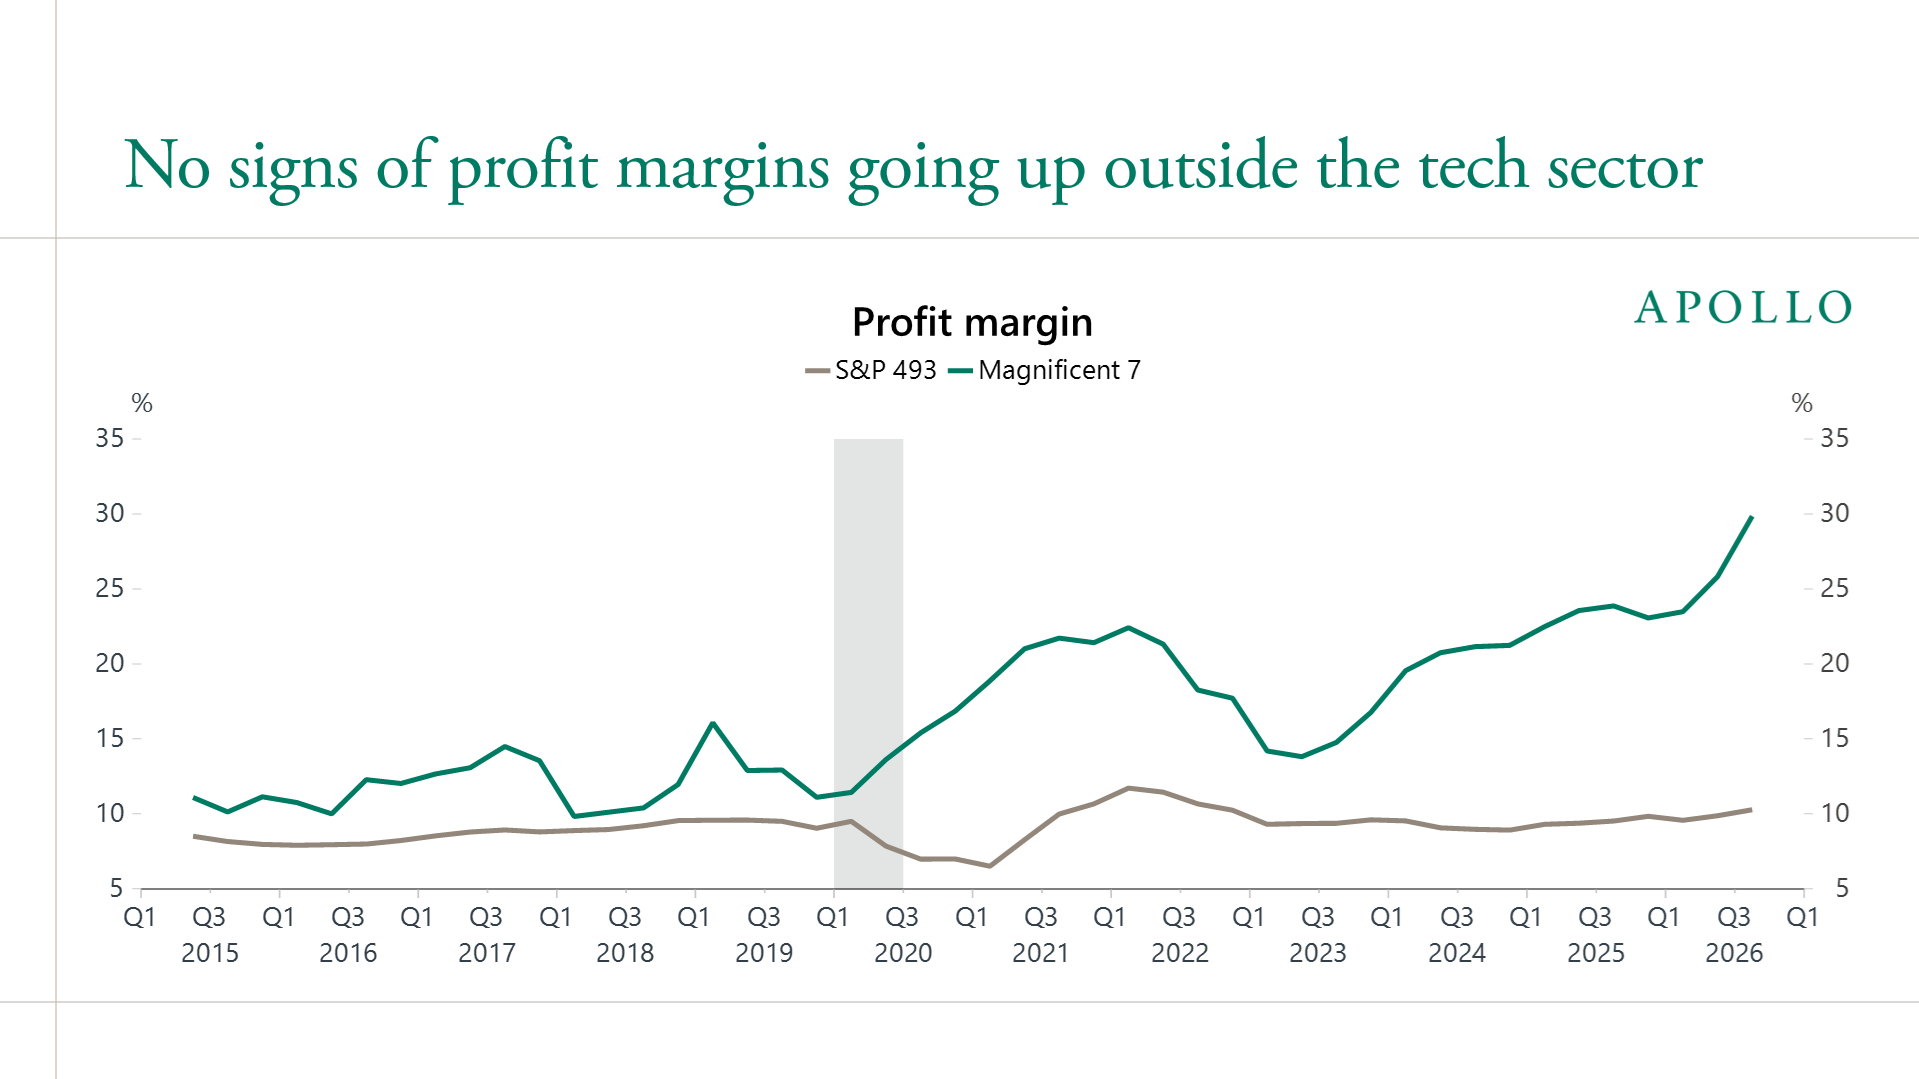
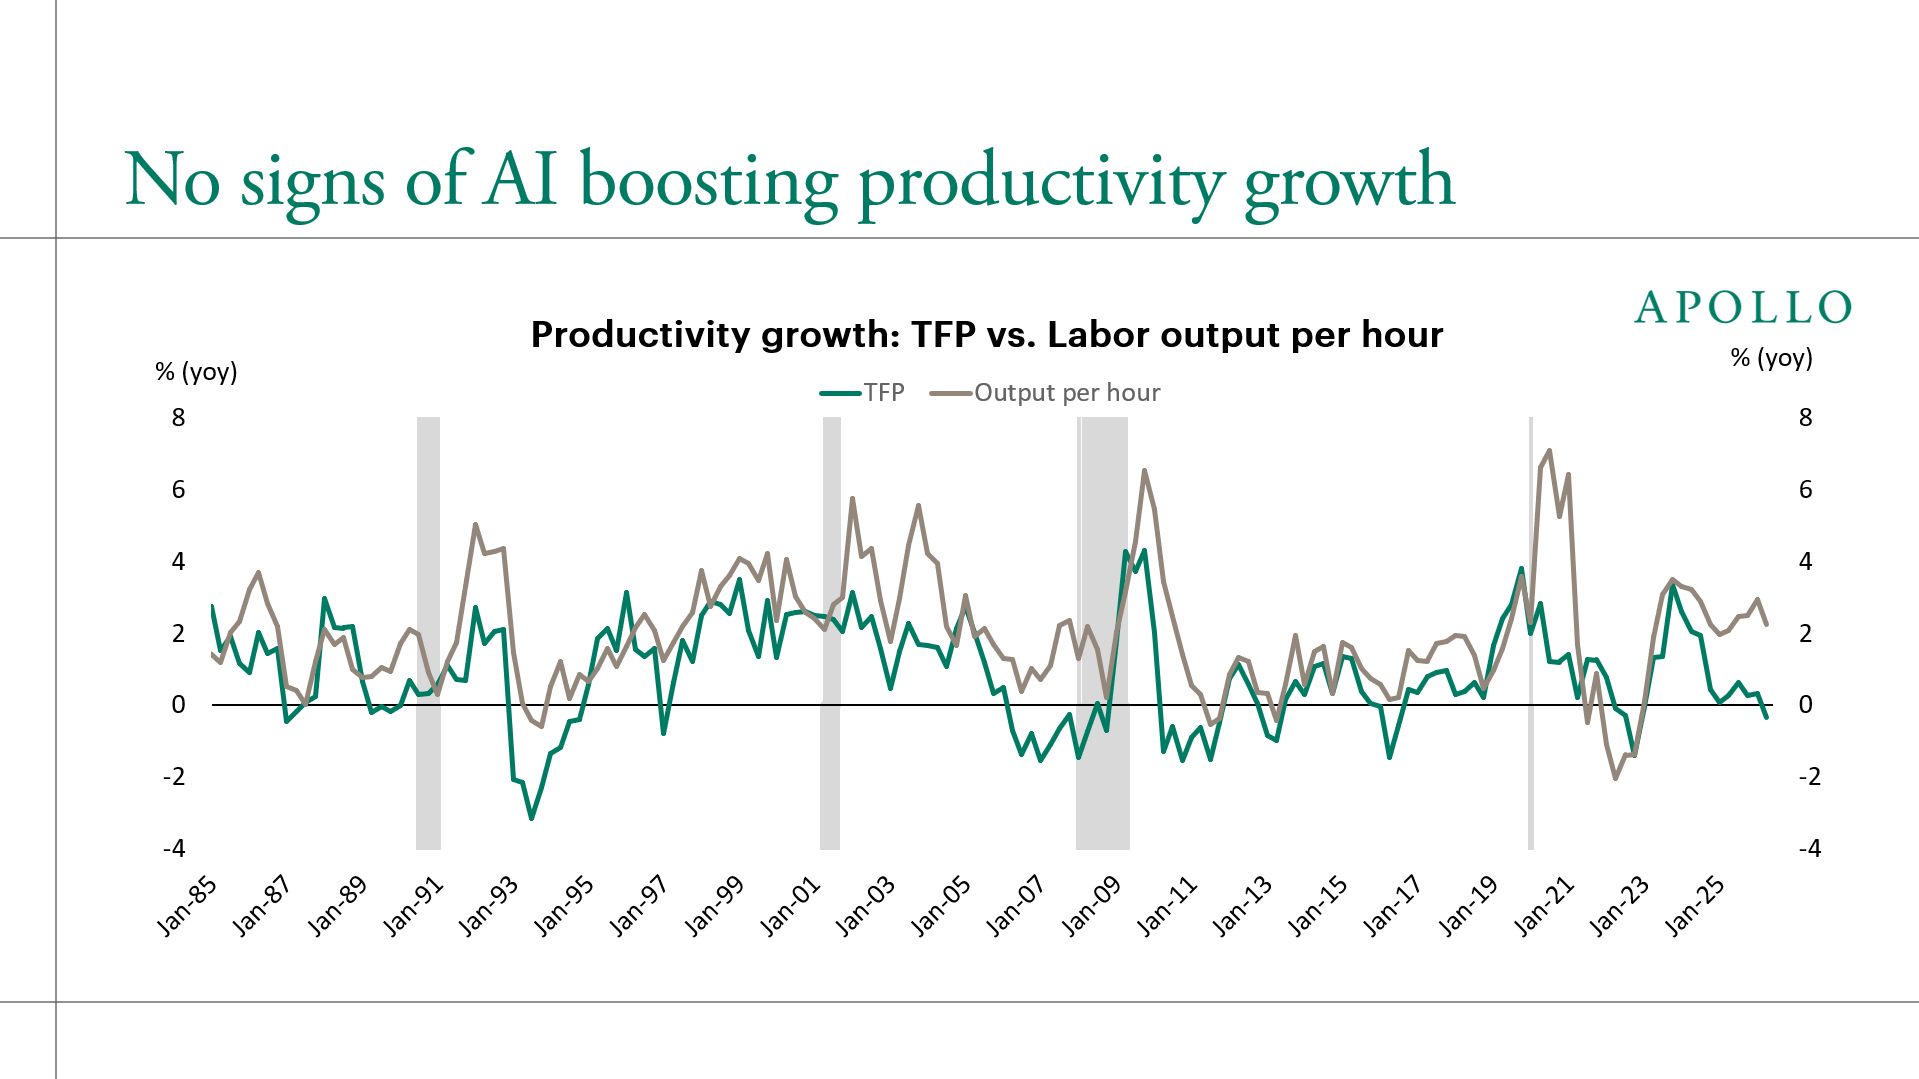
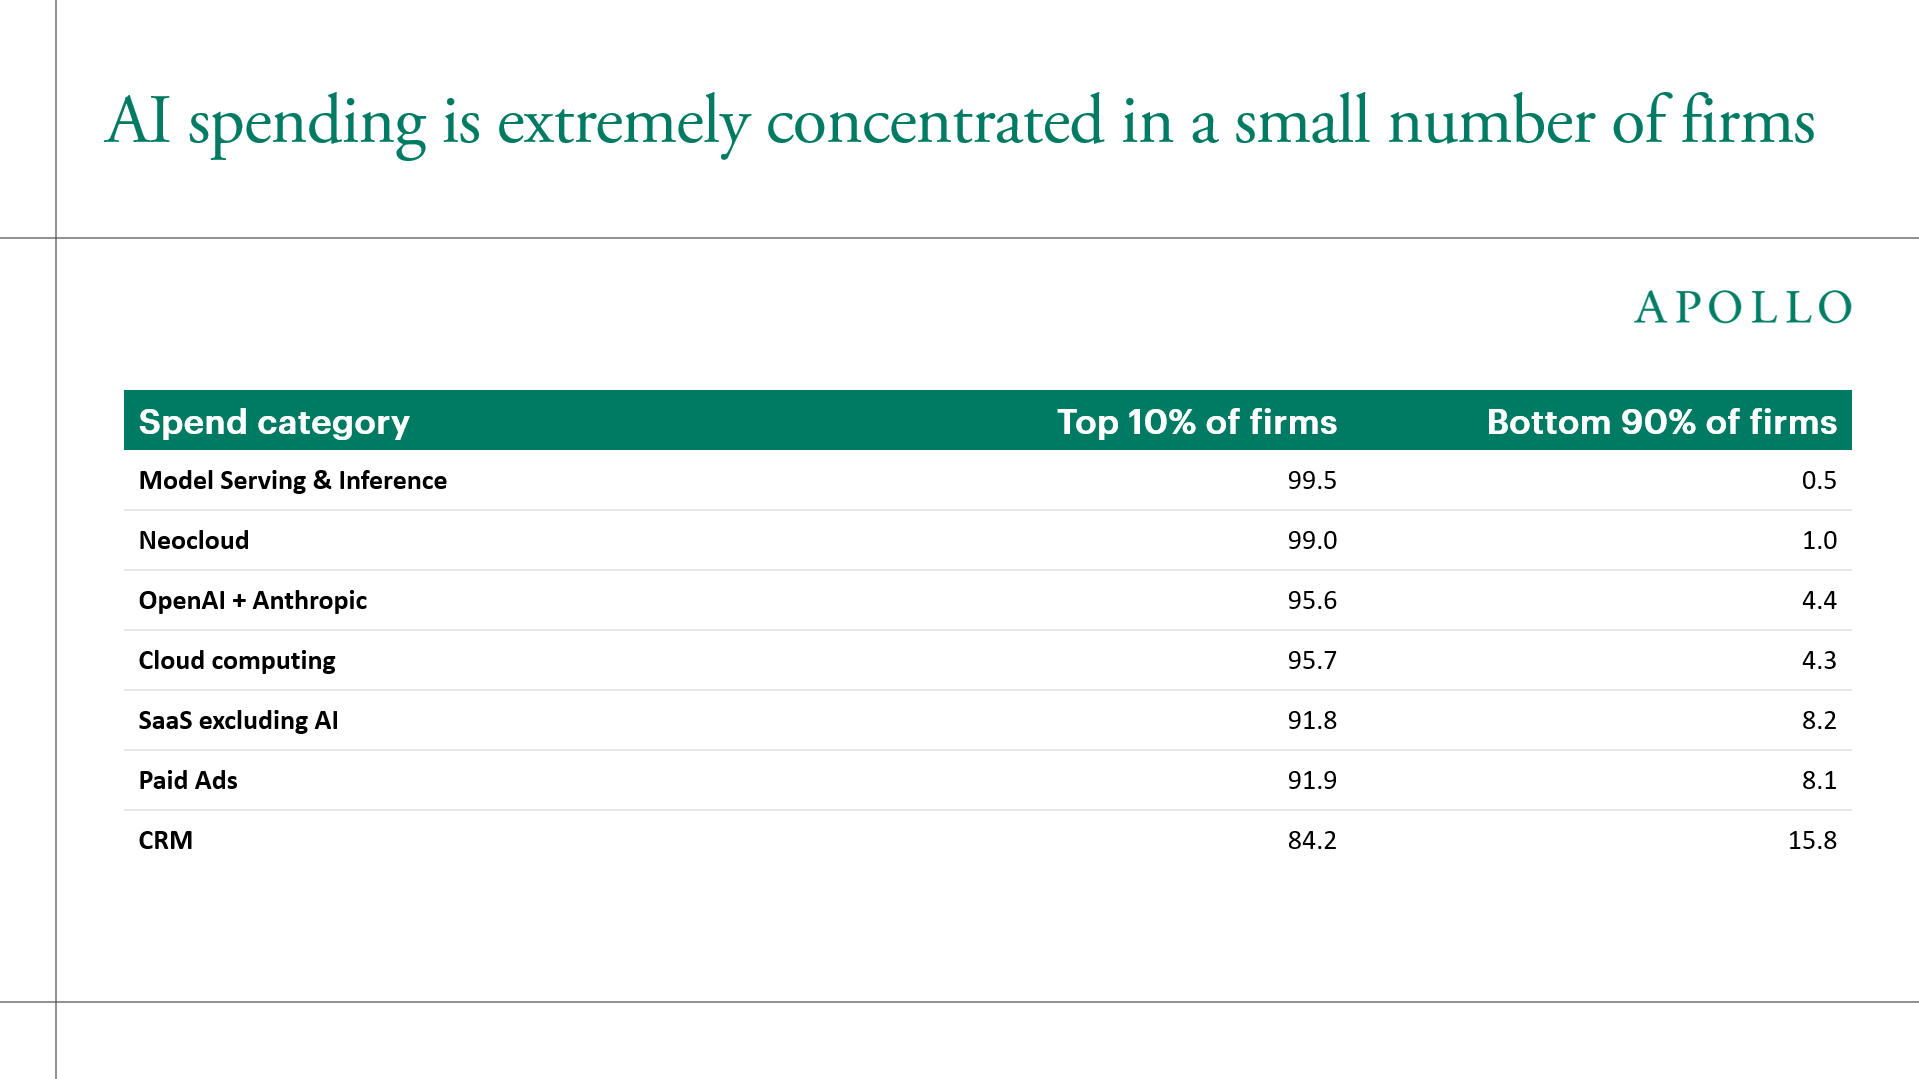
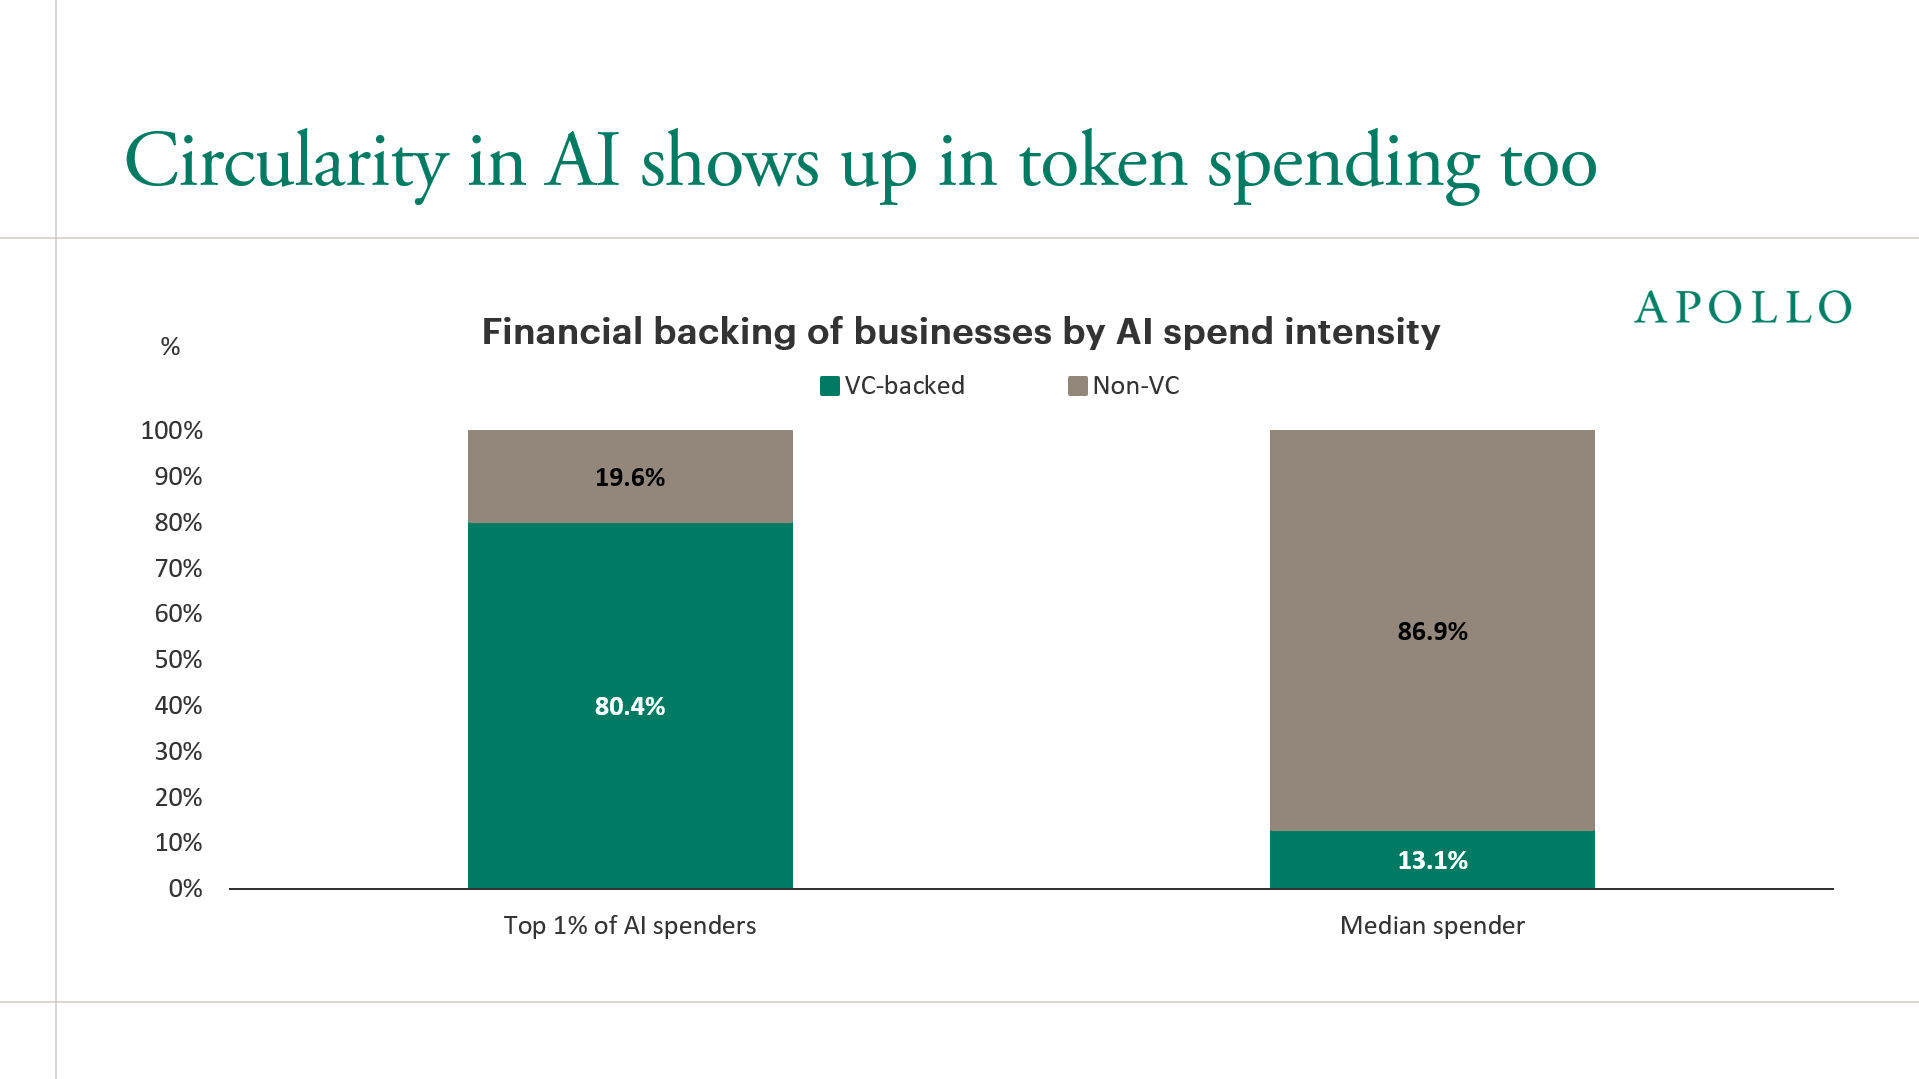
The charts are descriptive aggregates. The note does not show a comparison between AI-adopting and non-adopting firms, identify which firms actually deployed AI, isolate AI from other changes, or estimate a counterfactual. Therefore, flat aggregate measures can support “no visible aggregate change in these series” but cannot identify AI’s causal return, prove every non-tech company has zero return, or rule out gains concentrated in specific firms/tasks. The note’s explanations about judgment, trust, accountability, and context are Slok’s attributed interpretation, not estimates from the chart data. The note itself includes an Apollo disclaimer that its opinions and estimates may change.
Source: TechCrunch seed; Apollo primary note and chart credits.
Measure/status: aggregate revenue-per-worker, margin, and productivity series show no clear rise for non-Mag-7 S&P firms in Apollo’s presentation; descriptive/no attribution, not a causal zero-effect estimate.
2. Firm returns, adoption, and diffusion
2.1 Executives often report adoption without a realized firm-level change
A 2026 NBER working paper, “Firm Data on AI”, based on nearly 6,000 senior executives at firms in the United States, United Kingdom, Germany, and Australia, reports 69% active firm AI use. More than two-thirds of senior executives said they personally used AI in a typical week, but average use was about 1.5 hours weekly and roughly one-quarter of executives reported no use. Looking back over three years, about nine in ten executives reported no effect on productivity or employment at their own firm. The same executives forecast average productivity growth of 1.4%, output growth of 0.8%, and employment decline of 0.7% over the next three years; employees in a separate U.S. sample expected employment to rise 0.5%. The contrast is between retrospective executive reports and future expectations, not realized accounts. The authors’ summaries say the survey used stratified samples and central-bank business panels. Since the outcome is executive-attributed impact, it is not an audited firm-level causal estimate; the broad “AI” category also does not isolate GenAI from other AI technologies. The retrospective report is no reported effect for most firms, while the prospective effect is not yet measured.
A separate 2026 U.S. Census Bureau working paper uses a nationally representative AI supplement to the Business Trends and Outlook Survey for November 2025–January 2026. It reports AI use in a business function at 18% of firms (32% employment-weighted), with use concentrated in larger firms and knowledge-intensive sectors. Among adopters, 57% used AI in three or fewer business functions; writing, document analysis, and information search were prominent tasks, and 65% limited use to three or fewer tasks. Task-level use occurred in 23% of firms (41% employment-weighted). The authors report positive correlations between breadth of integration and commercial performance, while AI-related employment declines were reported by only 2% of firms. These are useful adoption-depth data, but the performance relation is correlational and does not establish AI caused the higher performance. “AI use” at firm, function, and worker-task levels are different measures; the source explicitly finds that they do not always coincide.
The Census supplement is a national firm sample but still captures use/reports, not a randomized rollout. The two adoption rates (firm-weighted and employment-weighted) describe different denominators. It supports limited diffusion depth alongside a positive breadth-performance correlation, not a universal absence of benefits.
2.2 Corporate surveys report a gap between use-case effects and enterprise-level EBIT
McKinsey’s 2025 Global Survey on AI collected 1,993 online survey responses across 105 countries in June–July 2025. Eighty-eight percent of respondents said their organization regularly used AI in at least one business function, but most remained in experimentation/pilot stages and about one-third said enterprise AI had begun scaling. Only 39% attributed any enterprise-level EBIT impact to AI, and most in that group said AI contributed less than 5% of EBIT; approximately 6% met McKinsey’s “high performer” definition of at least 5% EBIT attributable to AI plus significant value. Respondents also reported use-case cost or revenue effects and other qualitative benefits. This is a self-reported, commercial survey, weighted by country GDP, not audited earnings; the question combines respondent attribution with an organization-wide outcome. “Only 39% report any EBIT impact” is not the same as “61% objectively got no return.”
McKinsey’s 2026 Global Survey is a separate wave: 1,719 participants across 97 countries, fielded May–June 2026. It found 37% reporting any positive AI contribution to organizational EBIT, essentially flat year over year, while eight in ten respondents said AI improved their own productivity. Mid-level managers and individual contributors more often reported negative effects or strain than executives (47% versus 31%). Respondents cited cost reductions in some functions and revenue increases in others. These are again self-reports, not a linkage of adoption to audited accounts. The individual-versus-enterprise gap is a finding about different reporting levels, not proof that individual reports are false.
S&P Global Market Intelligence’s 2025 Voice of the Enterprise survey analysis reports a survey of 1,006 mid-level/senior IT and line-of-business professionals in North America and Europe. Among companies with AI projects in proof-of-concept or production, the share saying most AI initiatives were abandoned before production rose from 17% in its prior year survey to 42%; organizations reported scrapping an average 46% of proof-of-concept projects before production. Forty-six percent reported no single enterprise objective with a “strong positive impact” from GenAI, while 19% reported strong positive impact across most objectives. The survey is a commercial research product (451 Research/S&P Global), self/management-reported and conditional on firms already investing in AI; “abandoned before production” is not necessarily a failed project if the project was deliberately stopped. The result is evidence of a difficult pilot-to-production path and mixed/limited reported impacts.
2.3 Large headline failure claims have methodological caveats
The July 2025 MIT NANDA “GenAI Divide” report says that 95% of organizations get “zero return,” while only 5% of integrated pilots extract millions in value. Its methods note describes a January–June 2025 multi-method study: review of over 300 publicly disclosed AI initiatives, structured interviews with representatives of 52 organizations, and survey responses from 153 senior leaders recruited at four industry conferences. The report says company-specific data and quotes were anonymized. It defines a successful task-specific implementation as one users or executives describe as causing marked, sustained productivity and/or P&L impact. It also says the deployment figures are directionally based on interviews rather than official company reporting, category sample sizes vary, and success definitions may differ. The headline is therefore a study team’s synthesis/definition, not an audited, representative measurement of all organizations or an independently validated 95% failure rate. Its discussion of brittle workflows, weak contextual learning, and misalignment with daily operations is attributed to interview and implementation analysis.
Atlassian’s 2025 AI Collaboration Report surveyed 180 Fortune 1000 executives and 12,000 knowledge workers. It reports that 96% of executives said AI had not delivered meaningful ROI and only 4% reported dramatic improvements in efficiency, innovation, or work quality, while workers reported personal productivity gains and time savings. This is a vendor-sponsored/commercial survey with no audited financial measure in the accessible summary; its own framing is that individual speed did not yet translate to company-wide transformation. The executive/worker discrepancy does not resolve whether self-reported individual time savings produced measurable net output.
3. Task-level productivity, including coding
3.1 Results vary by task, skill, and workflow
The strongest adverse coding finding comes from METR’s randomized study, published in July 2025. Sixteen experienced open-source developers, averaging about five years’ experience in their own mature repositories, completed 246 real issues. Tasks were randomly assigned with AI tools allowed or disallowed; AI users mainly used Cursor Pro with Claude 3.5/3.7 Sonnet. The participants forecast a 24% speed improvement before tasks and later estimated about 20% improvement, but the randomized estimate was 19% longer completion time with AI, with the paper reporting a confidence interval of about +2% to +39%. The paper discusses possible setting-specific causes, including repository context and review standards, and says design artifacts cannot be completely excluded. This is a small but realistic experiment on experienced developers maintaining their own complex projects; it does not establish that AI slows all developers or current tools in every software task.
METR’s February 2026 update reports a later experiment, but explicitly says selection and measurement problems made it an unreliable estimate of the current effect: developers increasingly declined to join if they had to work without AI, pay fell, and the team could not reliably measure time for some multi-agent users. For original participants, the later point estimate was an 18% speedup with a confidence interval spanning -38% to +9%; for newly recruited developers it was a 4% speedup with a -15% to +9% interval. METR said these data were only weak evidence about the magnitude. This update belongs to the same METR experiment program, and it prevents treating the 2025 slowdown as a timeless effect.
A distinct three-company field-experiment paper, published in Management Science online in February 2026, combines randomized coding-assistant access experiments at Microsoft, Accenture, and an anonymous Fortune 100 company. Across 4,867 developers, the combined estimate was a 26.08% increase in tasks completed (standard error 10.3%), with higher adoption and gains among less experienced developers. Individual experiments were noisy and varied. This provides positive but bounded evidence, alongside the METR result, and the paper’s primary outcome is task completion rather than enterprise profit or long-term software quality.
DORA’s 2024 State of DevOps research surveyed over 39,000 technology professionals. Its statistical model associated increased AI adoption with greater individual productivity/flow and job satisfaction, but also estimated that a 25% adoption increase corresponded to 1.5% lower delivery throughput and 7.2% lower delivery stability (89% uncertainty intervals in its report). DORA attributes this trade-off to faster code generation potentially producing larger batches that are harder to review. This is observational, survey-based modeling, not a randomized causal estimate. It measures software delivery system outcomes, which differ from code-writing speed.
3.2 Writing, support, consulting, public-sector tasks: positive and negative effects coexist
In the customer-support field study “Generative AI at Work”, Brynjolfsson, Li, and Raymond analyzed a phased rollout to about 5,179 agents at a Fortune 500 software company, using customer-service interaction data. Average issues resolved per hour rose about 14%, with the largest gains—up to 35%—for the least skilled/experienced agents. The most experienced/highest-skilled agents gained little, and some customer-satisfaction measures showed small declines for the top quintile. This is a positive average in a particular human-support workflow with heterogeneous effects; it is not a general enterprise ROI estimate.
A preregistered online experiment by Noy and Zhang in Science used 453 college-educated professionals completing incentivized, occupation-specific writing tasks. ChatGPT users spent 40% less time and evaluator-rated quality rose 18%. This is a clear positive short-task result, but the task was online and controlled; it measured a writing product, not organizational adoption costs, downstream review, or firm profits.
The 2023–2026 Harvard/BCG “jagged frontier” experiment paper tested GPT-4 with 758 BCG consultants performing consulting tasks. In tasks within the tool’s demonstrated frontier, AI improved speed/quality. In one task designed outside that frontier, controls were correct 84.5% of the time, while the AI conditions were 60% and 70.6% (a combined decline of about 19 percentage points). The result is mixed and sensitive to task frontier/benchmark setup. It does not show that all AI assistance is negative; it shows that fluent AI assistance can reduce correctness when a task lies outside its capability frontier.
A preregistered public-sector field experiment by Fitzpatrick and colleagues paper tested two composite tasks. In a document-understanding task, GenAI increased human-rated answer quality 17% and reduced completion time 34%. In a data-analysis task, answer quality fell 12% and mean completion time did not significantly differ from controls. These were mixed task results in one public-sector setting; a non-significant time difference is not evidence of exact zero change. The accessible source is the paper’s abstract and summary; detailed sample information should be taken from the paper itself rather than inferred from later coverage.
Dillon, Jaffe, Immorlica, and Stanton’s randomized field experiment covered 7,137 knowledge workers across 66 firms over six months. Workers were randomly offered an integrated GenAI assistant for email, documents, and meetings. Among treated workers who used it in more than half the sample weeks, email time fell by 3.6 hours weekly (the intent-to-treat estimate was 1.3 hours); documents were completed moderately faster, and meeting time did not significantly change. In the second half of the study, frequent users spent two fewer hours per week on email and worked less outside regular hours. The authors did not detect changes in quantity or composition of tasks from individual access. These are behavior/time-use outcomes, not measured financial return or a productivity-per-total-input measure. Some authors were Microsoft Research employees; the paper says Microsoft reviewed for privacy but authors controlled results.
Humlum and Vestergaard’s “Still Waters, Rapid Currents” links Danish worker/employer adoption surveys to administrative records and uses difference-in-differences. It reports precise null effects on earnings and recorded hours for workers and workplaces exposed to chatbots, ruling out average effects larger than 2% about two years after ChatGPT’s launch. It also documents task reorganization and newly reported AI-related tasks. This is no detectable average effect on conventional wage/hour outcomes, not a claim that no work changed; the authors report workers’ perceived productivity benefits and work changes beneath the wage/hour data. The NBER landing page is accessible; the full working-paper source returned an access error during this review.
4. Rework, verification, code quality, and reliability costs
4.1 Verification can offset reported time savings
Stack Overflow’s 2024 Developer Survey received 60,907 responses to the AI-use question. Developers reported broad use, but professional developers were less likely than learners to trust AI output (about 41% versus 55% in the source breakdown); 66% of professional developers named distrust as a team/company challenge, and some reported additional code/PR review work. The 2025 survey had more than 49,000 responses from 177 countries overall; it found 84% used or planned to use AI tools, while 46% did not trust output accuracy and 33% did trust it. These are self-selected annual survey samples and perceptions, not objective error or time measurements. The 2024/2025 waves are one survey series, not independent replications.
GitClear’s 2025 code-quality report analyzes 211 million changed lines across Git commits from January 2020–December 2024. It reports increased duplication/copy-paste indicators and code churn relative to its prior forecast as AI code assistants took a larger role. The reported association is about code-change patterns and maintainability proxies; GitClear’s data do not identify AI authorship at every line or randomly assign tool use, so trends cannot be attributed causally to AI. This is observational commercial analysis with code-maintenance indicators, not a direct measure of software quality or financial cost.
A 2026 Workday survey of 3,200 active AI users at organizations with at least $100 million annual revenue, fielded by Hanover Research in November 2025, reports 85% saved 1–7 hours per week and nearly 40% of reported savings were spent correcting, rewriting, or verifying AI output. Only 14% reported consistent clear positive net outcomes. The survey was commissioned and publicized by Workday, an AI and enterprise-software seller, and only sampled active users at larger employers. Measures are self-reported perceived time saved/rework, not time-study accounting.
Zapier’s 2026 AI Workslop survey used 1,100 U.S. AI users at firms with 250+ employees, recruited by Centiment in a two-day November 2025 survey. It reports 92% said AI boosted productivity, but respondents estimated 4.5 hours per week on average correcting/revising AI output; 74% reported at least one negative consequence. The data are unweighted, self-reported, and commissioned by an automation vendor. The simultaneous positive productivity perception and reported cleanup burden should be preserved; neither is a net audited output measure.
BetterUp Labs and Stanford Social Media Lab’s workslop survey surveyed 1,150 full-time U.S. desk workers online in August–September 2025. Forty percent said they received AI-generated work that looked complete but lacked useful substance in the prior month; recipients estimated such work at 15.4% of work received and reported about 1 hour 56 minutes to handle each incident. The study authors convert this into estimated monthly labor costs. The HBR-linked research is self-reported and not peer-reviewed, BetterUp sells coaching services, and the cost figures extrapolate survey responses rather than being payroll or audited records. It is a signal about perceived downstream rework, not a measured causal company-wide loss.
4.2 Specific high-stakes tasks show residual error and supervision requirements
Magesh et al.’s preregistered legal-research-tool evaluation manually scored more than 200 legal queries posed to GPT-4, Lexis+ AI, Westlaw AI-Assisted Research, and Ask Practical Law AI. Lexis+ AI responses were accurate and grounded on 65% of queries; Westlaw on about 42%; Practical Law on about 19%. The study reports hallucinations in 17–33% of answers across products and incomplete answers/refusals at different rates. Legal retrieval-augmented products performed better than general GPT-4 on some measures, but did not eliminate errors. This is task-specific benchmark evidence, not an estimate of actual law-firm error incidence or productivity; the authors note closed proprietary systems and the difficulty of evaluating them.
The 2026 OSWorld 2.0 computer-use agent benchmark evaluates 108 long-horizon workflows across professional and everyday tasks; the median human task took about 1.6 hours and frontier runs required hundreds of tool calls. Under a strict binary-completion criterion at 500 steps, the strongest reported configuration completed 20.6% of tasks and received a 54.8% partial score; GPT-5.5 completed about 13%. Authors report failures involving lost constraints, missed changes, guessing instead of asking, and skipped verification. This is preprint benchmark evidence in a controlled simulated environment, not a direct business deployment study; it tests end-to-end computer-use capability and is not interchangeable with shorter agent benchmarks. It does show how task-level completion can be far below component or short-task success.
5. Skill, cognition, workload, and organizational spillovers
5.1 Immediate skill acquisition can fall even where output is produced
Anthropic researchers’ randomized coding-skill study assigned 52 developers to learn an unfamiliar Python library with or without AI support. The AI group scored 17 percentage points lower on an immediate quiz about code and concepts, while the average task-time reduction was small and not statistically significant. The paper says the AI interaction style mattered; participants who used AI to ask for explanations could retain more. This is short-term experimental evidence from one coding library and one chat-based assistant; it does not measure long-run workplace skill decay. It was authored by Anthropic researchers and the paper is a preprint.
A separate 2026 Nature Human Behaviour RCT gave 487 management consultants access and training to use ChatGPT on data-science tasks outside their expertise. Treated consultants performed better on three tasks than controls while using AI, but their results remained below expert data scientists; the authors found no evidence of better technical-answer performance without ChatGPT afterward. The finding is temporary tool-supported performance without detected post-task knowledge gain, not proof of lasting skill loss. The study population and tasks are specific; the full article’s abstract is accessible.
Microsoft Research and Carnegie Mellon’s CHI 2025 survey collected 936 examples from 319 knowledge workers. Greater confidence in GenAI was associated with less reported critical-thinking effort, while users’ own task confidence predicted more effort; respondents described verification, integration, and task stewardship shifting as AI entered work. It is self-reported and observational, not a randomized test showing cognitive ability declined. The authors note risks when users accept outputs without understanding/verification and also document ways workers used AI to learn.
5.2 Work may expand instead of becoming shorter
UC Berkeley Haas’s February 2026 report on an ongoing ethnography, also described in HBR, covers eight months inside a 200-person U.S. technology company and more than 40 interviews. Researchers report employees who embraced AI taking on broader tasks, working faster, and extending work into additional hours, often without management directly requiring it. This is qualitative, in-progress single-company fieldwork, not a representative or causal estimate of average hours/burnout. It records organizational workload spillovers that an isolated task-speed measure would not capture.
5.3 Adoption expectations and promotional measurement
The U.S. Federal Reserve Board’s July 2026 indicators note compiles public indicators of GenAI capability/cost, investment/adoption, productivity, and labor. Its comparison of sector productivity finds trends in high-, medium-, and low-AI-exposure sectors relatively consistent so far, suggesting micro-level gains have not yet added a large aggregate signal. The note emphasizes that AI uptake is still shallow, technology investment may precede productivity, intangible complementary investments are hard to measure, and high-exposure sectors may have differed before AI. It is a measurement synthesis, not a causal study or claim that no future gain can emerge.
A Kansas City Fed analysis reports U.S. labor-productivity growth above its pre-pandemic trend since 2022, but says a small group of industries accounts for most of the gains. Higher AI adoption correlates with faster industry productivity growth, but explains little of the shift in aggregate contributions. This is correlational industry-level evidence; the article says AI adoption is still spreading and does not establish that AI caused, or did not cause, particular productivity trends.
Daron Acemoglu’s 2024 task-based macro model estimates no more than about 0.66% cumulative U.S. TFP increase over 10 years from AI, using existing estimates of task exposure and task-level productivity. The paper argues even that could be overstated because hard-to-learn tasks involve context-sensitive judgment and lack objective outcomes for learning. This is a model-based projection, not measured realized productivity, and its estimate depends on assumptions about which tasks are exposed and their cost savings. It bounds some large promotional forecasts under the selected framework; it does not rule out channels excluded from the model.
5.4 Classical/industrial AI must not be collapsed into GenAI evidence
The Census Center for Economic Studies’ industrial AI working paper studies U.S. manufacturing using detailed Census data for 2017 and 2021, before mainstream LLM deployment. It reports a “productivity J-curve”: industrial AI use is associated with short-run losses to productivity and profitability, increased work-in-progress inventory, robot investment, and labor shedding; earlier adopters show stronger later growth conditional on surviving. Losses are concentrated among older businesses and linked partly to abandoning structured production-management practice. This is classical industrial AI/adjustment-cost evidence, not GenAI evidence. The authors describe it as causal evidence, but it is a working paper not reviewed as a Census Bureau publication; the paper says its views are the authors’ and not the Bureau’s. It demonstrates that adoption may initially reduce measured output/profit while organizations adapt.
By contrast, the Chicago Fed’s 2026 study of AI patents uses U.S. patent and firm data over roughly 30 years. Its regressions associate a one-standard-deviation increase in AI patent value relative to capital—about a $270,000 patent value—with five-year increases of 1.3% in capital, 1.0% in revenue, 0.8% in employment, and 0.3% in TFP. Firm-level estimates were stronger than sectoral/aggregate effects. This is positive classical-AI patent evidence, not a study of ChatGPT or GenAI; patent value is a proxy for innovation, and the regressions are observational. It should not be used as direct proof of GenAI returns, nor should GenAI’s current limited effects be generalized to all historical AI.
The OECD’s 2025 discussion of measuring AI investment notes definitional ambiguity, overlap with robotics and software, fragmented investment sources, and limitations of traditional national-account categories for identifying AI-specific investment. The point is measurement uncertainty: if “AI use,” AI investment, and AI-related output are defined differently, adoption and return estimates from unlike sources are not directly comparable.
5.5 Promotion and market incentives are documented, but they do not measure average ROI
The FTC’s Operation AI Comply actions document enforcement against companies accused of marketing AI tools or AI-enabled money-making schemes with unsupported claims. In the DoNotPay case, FTC allegations said the company had not tested whether its “AI lawyer” matched human-lawyer competence; other complaints concerned purported AI-run online storefronts whose promised income often did not materialize. These are specific enforcement cases and allegations, not evidence that most legitimate AI products fail. They do establish that AI-branded benefit claims have sometimes been used without supporting validation. The legal outcomes and allegations vary by case; the enforcement record is not an economy-wide incidence estimate.
In a June 2026 Goldman Sachs interview, Goldman Research’s Jim Covello said enterprise buyers, model companies, and hyperscalers had yet to show returns on their spending and that the economics appeared more questionable than two years earlier. This is attributed analyst commentary, not a published dataset or study. It is recorded because it relates to financing/return claims; it is not independently counted as evidence of zero payoff.
Evidence boundaries
The evidence is heterogeneous in both technology and outcome. Some studies test short tasks; others survey perceived productivity, track task completion, compare wages/hours, analyze firm financial series, or evaluate a software benchmark. A gain on one task may not imply higher firm profit, and unchanged wages/hours may coexist with work reorganization. Surveyed adoption does not equal intensive use. A higher code-completion count does not establish faster validated software delivery. A non-significant estimate is not proof of exact zero. Aggregate trends cannot identify an AI effect without a credible comparison or attribution design.
Within the evidence reviewed here, adverse or absent outcomes include: no reported firm-level productivity/employment change for most executives over the prior three years; limited enterprise EBIT attribution in several commercial surveys; pilot abandonment; slower completion in one small real-world coding RCT; quality declines on certain tasks; reported verification/rework; lower immediate learning in one coding experiment; no detectable wage/hour movement in Danish data; and incomplete long-horizon agent task completion on a benchmark. Positive or mixed counter-evidence includes gains in writing, customer support, some coding experiments, tasks inside capability frontiers, and classical AI patent/productivity measures. These findings concern different technologies, populations, time periods, and outcome definitions; they do not resolve a single overall effect for “AI.”